With limited success for centuries, astronomers charted the stars with hopes of better understanding the universe until one day when Copernicus suggested that the earth was orbiting the sun. Once his epiphany was fully understood, empires could navigate the globe with unprecedented precision by knowing exactly where they were by looking up at the stars. Today, there is no shortage of cap rate/interest rate correlation theories in our industry. Perhaps more fully understanding commercial real estate cap rates and their orientation to interest rates can aid alternative investors in navigating the horizon of real estate investment opportunities.
Do cap rates somehow correlate with interest rates?
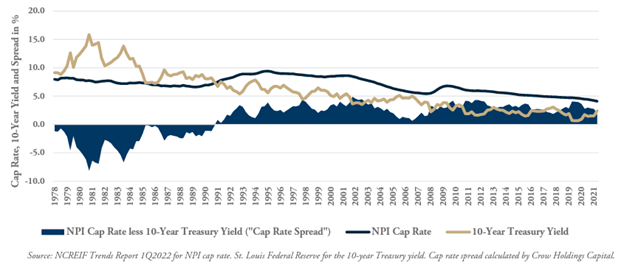
The graph below, which tracks bond yields and cap rates, suggests yes. But what is going on beginning around late 2021? Why, all of the sudden, is the spread between cap rates and interest rates so compressed?
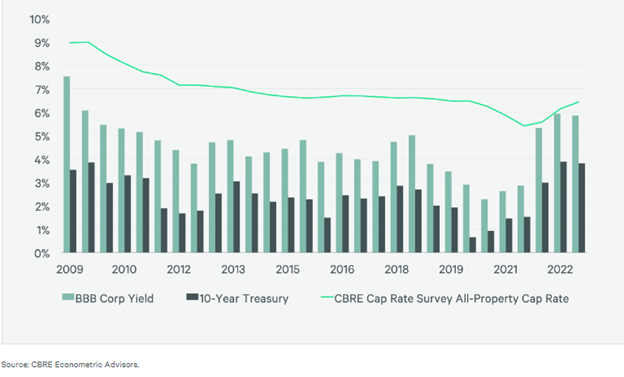
Perhaps, it’s because the real correlation is between cap rates and a single component of interest rates: the real return. That is to say, the real correlation is between cap rates and real interest rates (the inflation-adjusted rate-of-return). Interest rates have two components: an inflation return and a real return. For example, if your nominal (actual) return on a bond is 8%, but it now costs 6% more to buy a bag of groceries than when you started (a change in the Consumer Price Index), your inflation return is 6%, and your real return is 2%. But what if you purchase a commercial property at a cap rate of 5% for $1,000,000? Let’s say the expected year-1 NOI is $50,000. If inflation is 6%, and your NOI and property value keep up with inflation, they will be $53,000 and $1,060,000, respectively, in year 2. Your cap rate would remain at 5% (50,000/1,000,000= 5% and 53,000/$1,060,000=5%). Inflation is essentially removed from the equation, or at least mitigated to some extent, and the cap rate is your expected real-rate-of-return (in a generic sense, ignoring capital expenditure, etc...). In these instances, the real-rate-of-return on your bond purchase is 2%, and the real-rate-of-return on your real estate purchase is 5%.
Back to our graph: what explains the correlation going all the way back to the great recession up until sometime in 2021? Perhaps it can be explained by the fact that, since the great recession, and continuing through the Covid-19 pandemic, economic growth was stubbornly slow, which did not create inflation. Accordingly, there is a relatively small difference between nominal and real interest rates.
How low can you go?
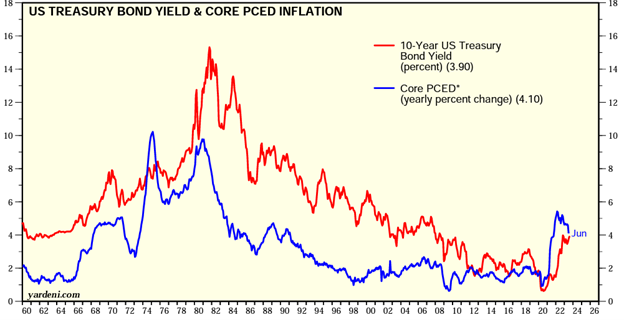
Focus on the blue line in the graph below from 2009 through 2021 and notice how inflation remained historically low and never got much above 2%. Because of consistently low inflation baked into interest rates, the graph above shows a somewhat consistent correlation, but as soon as high inflation levels are introduced, it becomes clear that the stronger correlation is between cap rates and real-rates-of-interest.
So, if cap rates are essentially expected real yields, let’s compare those yields (using risk-free U.K. Gilts as an available proxy) to real interest rates:
U.K. Property Yields and Real Interest Rates
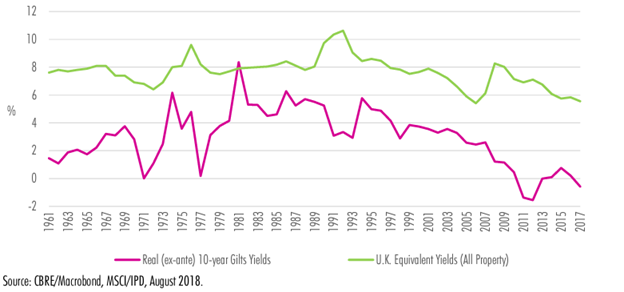
If you ignore some monetary turbulence in the 1970s and account for lags in the data, can you see the fit by visually shifting the green line slightly forward?
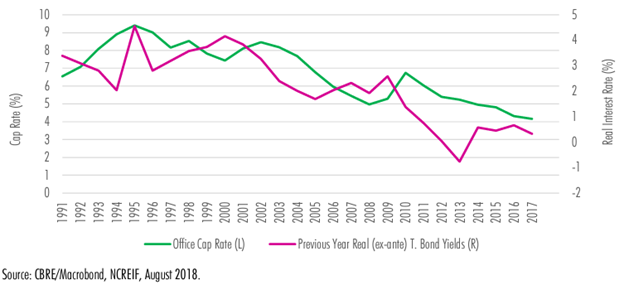
If you’re still not convinced that cap rates and real interest rates are correlated, the following illustrates their long term correlation (using office as a proxy for commercial real estate in general). The two are locked into a long-term dance and may even be correlated one-to-one. But, because cap rates also include a variable spread component, they do not necessarily move in lock-step.
Cap Rates and Real Interest Rates
Cap rates are locked into this long-term dance with real interest rates but not nominal interest rates (or even the risk-free nominal interest rate), as was made clear during a period of historically high levels of inflation. As the graph below illustrates, notice that when inflation was rampant, and a large component of treasury yields was the inflation return, cap rates did not follow. (as predicted, the spread not only compresses but becomes negative).
Cap Rates, 10-Year Nominal Treasury Yields, and Cap Rate Spread 1978-1Q2022
Now that the stars have aligned...
Ok, maybe cap rates correlate with the expected real-rate-of-return on risk-free government bonds, but why are they always higher? It is because investors do not usually desire return-free risk. Cap rates are equal to the expected risk-free-real-return (we’ll use the real return on treasuries as proxy, just play along and ignore the rating agencies), plus a spread, which is a function of (i) expected rent growth relative to overall economic growth, which captures real estate supply and demand, population demographics, etc.., (ii) the availability of debt, and (iii) the expected real performance of other assets. As to the last spread component, it seems intuitive that cap rates must somehow be impacted by the real returns available on other assets.
Perhaps cap rates are just now coming off historical lows because, since the great recession, for all of the stimulus efforts, economic growth in this country and abroad remained stubbornly slow. To a material extent, the deluge of cheap credit and excess money sloshing around in the economy was invested in such assets as stocks and real estate. By comparison, the bond markets also looked less attractive due to artificially suppressed interest rates (by quantitative easing). Even after the great recession, real estate investing still looked attractive relative to certain other risky business ventures. Accordingly, cap rates became increasingly compressed.
The sextant
Ok, so let’s bottom-line it. How can a theoretical understanding of cap rates be used to chart a course for the direction of cap rates? In theory, cap rates should be (i) the expected real risk-free-rate—we can also use expected-real-GDP for a proxy—and (ii) the spread described above. The spread is derived from expected Fed policy actions. How will its actions impact the growth of your real estate asset class relative to the economy, what lending conditions will prevail, and what returns can be achieved in competing sectors? Perhaps this framework can serve as a sextant, helping us navigate oceans of uncertainty and inverted yield curves.