With FactRight’s annual conference just around the corner, we thought we’d tease some of this year’s content by posting the latest real estate analysis from conference speaker Dr. Glenn Mueller. We’re excited for Dr. Mueller to share his insights with this year’s attendees. Dr. Mueller is currently Professor at the University of Denver’s Franklin L. Burns School of Real Estate & Construction Management and Real Estate Investment Strategist at Black Creek Group (with a full bio at the end of this post). His Q2 2018 Cycle Monitor is reproduced below. (For more of Dr. Mueller’s commentaries, visit Black Creek’s market insights webpage.)
Cycle Monitor — Real Estate Market Cycles
Second Quarter 2018 Analysis
Real Estate Market Cycle analysis of 5 property types in 54 Metropolitan Statistical Areas (MSAs).
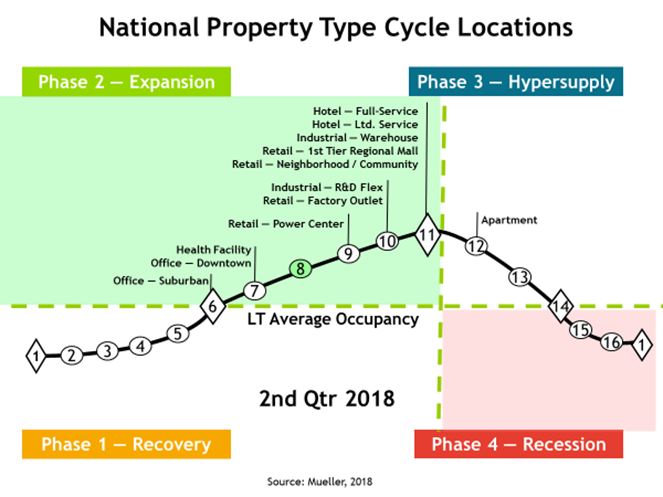
Point 11 on the cycle graphs throughout this commentary is the point of EQUILIBRIUM in the cycle where demand and supply are growing at the same rate. This is the BEST point in the cycle and is the point that we wish would last forever. It is thus the most desirable part of the cycle growth phase representing a BALANCED MARKET. We now green shade the growth phase of the cycle green, so that it is clear which markets have good growth fundamentals. Some have interpreted point 11 as the start of the hyper-supply phase of the cycle, which is incorrect. A balanced market can last for a long time. The data and technology now available in real estate markets could help equilibrium last a long time. Please find throughout this commentary for the details of how the cycle model works and read each property description analysis closely.
- Office occupancy was flat in 2Q18 and rents grew 0.3% for the quarter and 1.8% annually
- Industrial occupancy increased 0.1% in 2Q18 and rents grew 1.3% for the quarter and 6.2% annuallyDr
- Apartment occupancy increased 0.1% in 2Q18 and rents grew 1.6% for the quarter and 3.1% annually
- Retail occupancy increased 0.4% in 2Q18 and rents grew 0.5% for the quarter and 1.6% annually
- Hotel occupancy declined 0.01% in 2Q18 and room rates grew 4.0% for the quarter and 3.8% annually
The National Property Type Cycle Forecast graph shows relative positions of sub-property types.
The cycle monitor analyzes occupancy movements in five property types in 54 MSAs. Market cycle analysis should enhance investment-decision capabilities for investors and operators. The five property type cycle charts summarize 270 individual models that analyze occupancy levels and rental growth rates to provide the foundation for long-term investment success. Commercial real estate markets are cyclical due to the lagged relationship between demand and supply for physical space. The long-term occupancy average is different for each market and each property type. Long-term occupancy average is a key factor in determining rental growth rates — a critical indicator of commercial real estate returns.
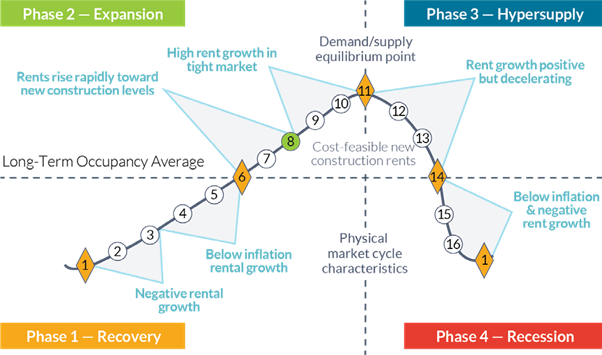
Rental growth rates can be characterized in different parts of the market cycle, as shown below.
Office
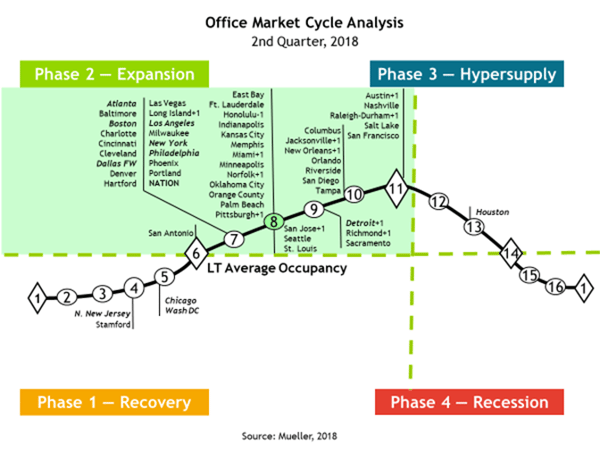
The national office market occupancy level remained flat in 2Q18 and increased 0.2% year over year. As seen in the 2Q18 cycle graph 49 of 54 markets are in the growth phase of the market cycle. Economic expansion with 4+% GDP growth is driving strong job growth in office using jobs. In most markets rising construction costs and interest rates require stronger development underwriting that is keeping supply in-balance with demand. Rents are rising with the strong demand and average national rents increased 0.3% in 2Q18 which produced a 1.8% increase year over year.
Note: Markets that have moved since the previous quarter are now shown with a + or - symbol next to the market name and the number of positions the market has moved is also shown, i.e., +1, +2 or -1, -2. Markets do not always go through smooth forward-cycle movements and can regress, or move backward in their cycle position when occupancy levels reverse their usual direction. This can happen when the marginal rate of change in demand increases (or declines) faster than originally estimated or if supply growth is stronger (or weaker) than originally estimated.Note: The 11-largest office markets make up 50% of the total square footage of office space we monitor. Thus, the 11-largest office markets are in bold italic type to help distinguish how the weighted national average is affected.
Industrial
Industrial occupancies increased 0.1% in 2Q18 and were up 0.4% year-over-year. 51 of 54 markets are at equilibrium point #11 in the cycle graph, which means supply is just keeping up with demand – the sign of a balanced market. Continued moderate job growth near 200,000 new jobs per month along with 4+% GDP growth in 2Q18 are driving consumer spending and demand for industrial space. Our forecast does not show the potential for hyper-supply in the next few years, as demand remains strong from the growing internet sales need for more distribution and local warehouse space. Industrial national average rents increased 1.3% in 2Q18 and increased 6.2% year-over-year.
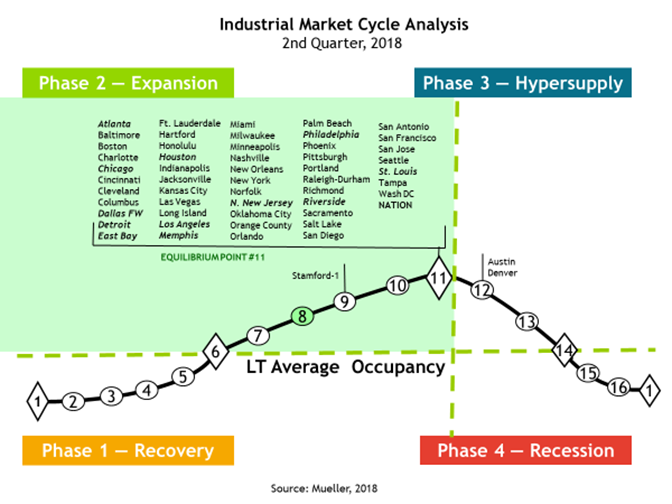
Note: The 12-largest industrial markets make up 50% of the total square footage of industrial space we monitor. Thus, the 12-largest industrial markets are in bold italic type to help distinguish how the weighted national average is affected.
Apartment
The national apartment occupancy average increased 0.1% in 2Q18 and was up 0.1 year-over-year. Job growth averaging near 200,000 per month continues to create robust demand for apartments. Increasing construction costs and construction labor shortages in many markets caused starts to finally decelerate slightly in May and if this continues the market could come back into equilibrium by 2020. Rising mortgage interest rates are also helping to slow purchases and price increases that justify new construction. Note that 22 markets are at point #11 where markets are in equilibrium. Average national apartment rent growth increased 1.6% in 2Q18 and 3.1% year-over-year.
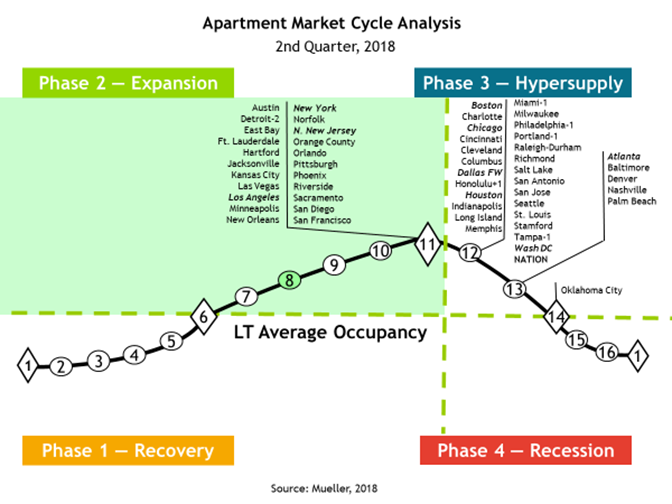
Note: The 10-largest apartment markets make up 50% of the total square footage of multifamily space we monitor. Thus, the 10-largest apartment markets are in bold italic type to help distinguish how the weighted national average is affected.
Retail
Retail occupancies improved 0.04% 2Q18 and were up 0.2% year-over-year. As the cycle chart shows, 51 of 54 retail markets are in the growth phase of the cycle. 40 of the 54 markets are at Equilibrium point #11 on the cycle graph and only 3 markets are in the hyper-supply phase of the cycle. Experience based retailers and internet retailers are creating strong demand for retail space that is easily absorbing failed older retail formats. New retail construction also remains at less than half historic growth rates, which helps to keep markets in balance. Average national retail rent growth increased 0.5% in 2Q18 and 1.6% year-over-year.
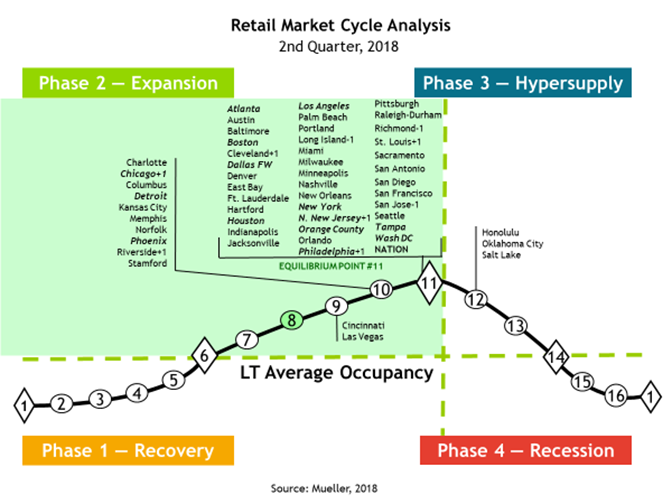
Note: The 14-largest retail markets make up 50% of the total square footage of retail space we monitor. Thus, the 14-largest retail markets are in bold italic type to help distinguish how the weighted national average is affected.
Hotel
Hotel occupancies decreased 0.1% in 2Q18 but increased 0.2% year- over-year. 36 of 54 markets are in the growth phase of the cycle. While strong GDP growth of 4+% in 2Q18 helped propel both business and leisure hotel demand further, new completions in some markets were higher than that increased demand. Branding and new hotel concept tiers are appearing to appeal to niche markets and in unique niche locations. The national average hotel room rate increased 4.0% in 2Q18 and 3.8% year-over-year.
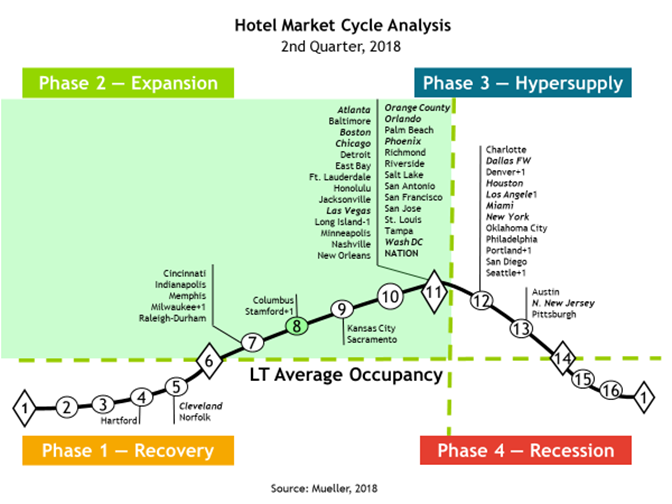
Note: The 14-largest hotel markets make up 50% of the total square footage of hotel space that we monitor. Thus, the 14-largest hotel markets are in boldface italics to help distinguish how the weighted national average is affected.
Market Cycle Analysis - Explanation
Supply and demand interaction is important to understand.
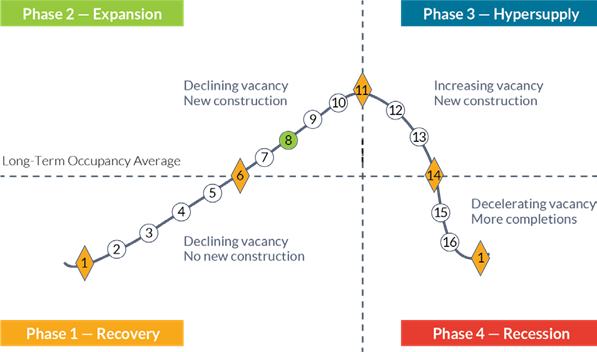
Starting in Recovery Phase I at the bottom of a cycle (see chart below), the marketplace is in a state of oversupply from either previous new construction or negative demand growth. At this bottom point, occupancy is at its lowest. Typically, the market bottom occurs when the excess construction from the previous cycle stops. As the cycle bottom is passed, demand growth begins to slowly absorb the existing oversupply and supply growth is nonexistent or very low. As excess space is absorbed, occupancies rise, allowing rental rates in the market to stabilize and even begin to increase. As this recovery phase continues, positive expectations about the market allow landlords to increase rents at a slow pace (typically at or below inflation). Eventually, each local market reaches its long-term occupancy average, whereby rental growth is equal to inflation.
In Expansion Phase II, demand growth continues at increasing levels, creating a need for additional space. As occupancy rates rise above the long-term occupancy average, signaling that supply is tight in the marketplace, rents begin to rise rapidly until they reach a cost-feasible level (point #8) that allows new construction to commence. In this period of tight supply, rapid rental growth happens, which some observers call “rent spikes.” (Some developers may also begin speculative construction in anticipation of cost-feasible rents if they are able to obtain financing). Once cost-feasible rents are achieved in the marketplace, demand growth is still ahead of supply growth — a lag in providing new space due to the time to construct. Long expansionary periods are possible and many historical real estate cycles show that the overall up-cycle is a slow, long-term uphill climb. As-long-as demand growth rates are higher than supply growth rates, occupancies increase. Equilibrium cycle point #11 is where demand and supply grow at the same rate, which could last for a long time. Before equilibrium, demand grows faster than supply; after equilibrium, supply grows faster than demand.
Hypersupply Phase III of the real estate cycle starts AFTER equilibrium point #11 — where demand growth equals supply growth. Most real estate participants do not recognize that equilibrium’s passing, as occupancy rates are at their highest (well above long- term averages), a strong and tight market. During Phase III, supply growth is higher than demand growth (hypersupply), causing occupancies to decline back toward the long-term occupancy average. While there is no painful oversupply during this period, new completions compete for tenants in the marketplace. As more space is delivered to the market, rental growth decelerates. Eventually, market participants realize that the market has turned down and commitments to new construction should slow or stop. If new supply grows faster than demand once the long-term occupancy average is passed, the market falls into Phase IV.
Recession Phase IV begins as the market moves below the long-term occupancy average with high supply growth and low or negative demand growth. The extent of the market down-cycle is determined by the difference (excess) between the market supply growth and demand growth. Massive oversupply, coupled with negative demand growth (that started when the market passed through long-term occupancy average in 1984), sent most U.S. office markets into the largest down-cycle ever experienced. During Phase IV, landlords lose market share if their rental rates are not competitive. As a result, they lower rents to capture tenants, even if only to cover a buildings’ fixed expenses. Market liquidity is also low or nonexistent in this phase, as the bid–ask spread in property prices is too wide. The cycle eventually reaches bottom as new construction and completions cease, or as demand begins to grow at rates higher than that of new supply added to the marketplace.
Important Disclosures and Certifications
I, Glenn R. Mueller, Ph.D. certify that the opinions and forecasts expressed in this research report accurately reflect my personal views about the subjects discussed herein; and I, Glenn R. Mueller, certify that no part of my compensation from any source was, is, or will be directly or indirectly related to the content of this research report.
The views expressed in this commentary are the personal views of Glenn R. Mueller and do not necessarily reflect the views of Black Creek Group itself. The views expressed reflect the current views of Dr. Mueller as of the date hereof and neither Mr. Mueller nor Black Creek Group undertakes to advise you of any changes in the views expressed herein.
The information contained in this report: (i) has been prepared or received from sources believed to be reliable but is not guaranteed; (ii) is not a complete summary or statement of all available data; (iii) does not constitute investment advice and is not a recommendation to buy or sell any particular securities; and (iv) is not an offer to buy or sell any securities in the markets or sectors discussed in the report. The main purpose of this report is to provide a broad overview of the real estate market in general.
Any estimates, projections or predictions given in this report are intended to be forward-looking statements. Although we believe that the expectations in such forward-looking statements are reasonable, we can give no assurance that any forward- looking statements will prove to be correct. Such estimates are subject to actual known and unknown risks, uncertainties and other factors that could cause actual results to differ materially from those projected. We expressly disclaim any obligation or undertaking to update or revise any forward-looking statement contained herein to reflect any change in our expectations or any change in circumstances upon which such statement is based.
The opinions and forecasts expressed in this report are subject to change without notice and do not take into account the particular investment objectives, financial situation or needs of individual investors. Any opinions or forecasts in this report are not guarantees of how markets, sectors or individual securities or issuers will perform in the future, and the actual future performance of such markets, sectors or individual securities or issuers may differ. Further, any forecasts in this report have not been based on information received directly from issuers of securities in the sectors or markets discussed in the report. Black Creek Group LLC disclaims any and all liability relating to this report, including, without limitation, any express or implied representations or warranties for statements or errors contained in, or omissions from, this report.
Tax considerations, margin requirements, commissions and other transaction costs may significantly affect the economic consequences of any transaction concepts referenced in this commentary and should be reviewed carefully with one’s investment and tax advisors. Investment concepts mentioned in this commentary may be unsuitable for investors depending on their specific investment objectives and financial position. Past performance is not a guarantee of future results. Investing involves risk, including the possible loss of principal and fluctuation of value.
Dr. Mueller serves as a Real Estate Investment Strategist with Black Creek Group. In this role, he provides investment advice to certain affiliates of Black Creek Group regarding the real estate market and the various sectors within that market. Mr. Mueller’s compensation from Black Creek Group and its affiliates is not based on the performance of any investment advisory client, offering or product of Black Creek Group or its affiliates.
Black Creek Group is a real estate investment management company that focuses on creating institutional-quality real estate financial products for individual and institutional investors. Certain affiliates of Black Creek Group also provide investment management services and advice to various investment companies, real estate investment trusts and other advisory clients about the real estate markets and sectors, including specific securities within these markets and sectors.
Dr. Mueller may from time to time have personal investments in real estate, in securities of issuers in the markets or sectors discussed in this report, or in investment companies or other investment vehicles that invest in real estate and the real estate securities markets (including investment companies and other investment vehicles for which an affiliate of Black Creek Group may serve as investment adviser). Real estate investments purchased or sold based on the information in this report could directly benefit Dr. Mueller by increasing the value of his personal investments.
Author's Biography
Dr. Mueller has 42 years of real estate industry experience, including 35 years of research. Mueller is internationally known for his market cycle research on income producing real estate, his real estate securities analysis (REITs) research and his public and private market investment strategies and capital markets analysis.
He is a Professor at University of Denver’s F.L Burns School of Real Estate & Construction Management, teaching and doing research in real estate market cycles, development, feasibility, investments and real estate capital markets (REITs & CMBS). The academic program started in 1938 and offers undergraduate (BS) and graduate (MS & MBA) degrees in business RECM, as well as executive and distance learning programs. He has published 100+ research articles and 100 quarterly issues of his Real Estate Market Cycle Report. He is also the Real Estate Investment Strategist at Black Creek Group where he provides Real Estate Market Cycle Research and Investment Strategy for Black Creek’s Institutional Real Estate Investment Groups, Non-Traded and Public REIT groups.
He holds a B.S.B.A. Finance major from the University of Denver, MBA from Babson College, and Ph.D. in Real Estate from Georgia State University. He has held former research positions at Legg Mason Inc., PriceWaterhouseCoopers, ABKB/ LaSalle Real Estate Investors, and Prudential Real Estate Investors.
