One of the most common lines of inquiry we get from clients is how particular investment programs they have, or may be considering for their platform, stack up against similar programs, or more broadly, of all of the alternative investment options of a particular class or type, which ones outshine their peers. These queries are fruitful not only for initial reviews but for ongoing monitoring of platform programs.
Comparisons and benchmarking comprise a critical piece of the due diligence we provide to clients. One resource for broker dealers and registered investment advisors within FactRight’s Report Center are quarterly peer comparisons for non-traded multifamily REITs, healthcare REITs, hospitality REITs, and BDC programs. Levering S&P Global’s data platform, we report on key financial, portfolio, and operational metrics of each program within coverage, so our clients can easily grasp the relative scale and performance of current non-traded programs. What non-traded REITs have built the largest portfolios? How does the portfolio leverage compare to similar REITs? Which program may be most sensitive to interest rate fluctuations? What BDC portfolios are posting the largest gains (or losses)? Program metrics like these are laid out against the peer average so you can see the relative position of the issuers you’re evaluating.
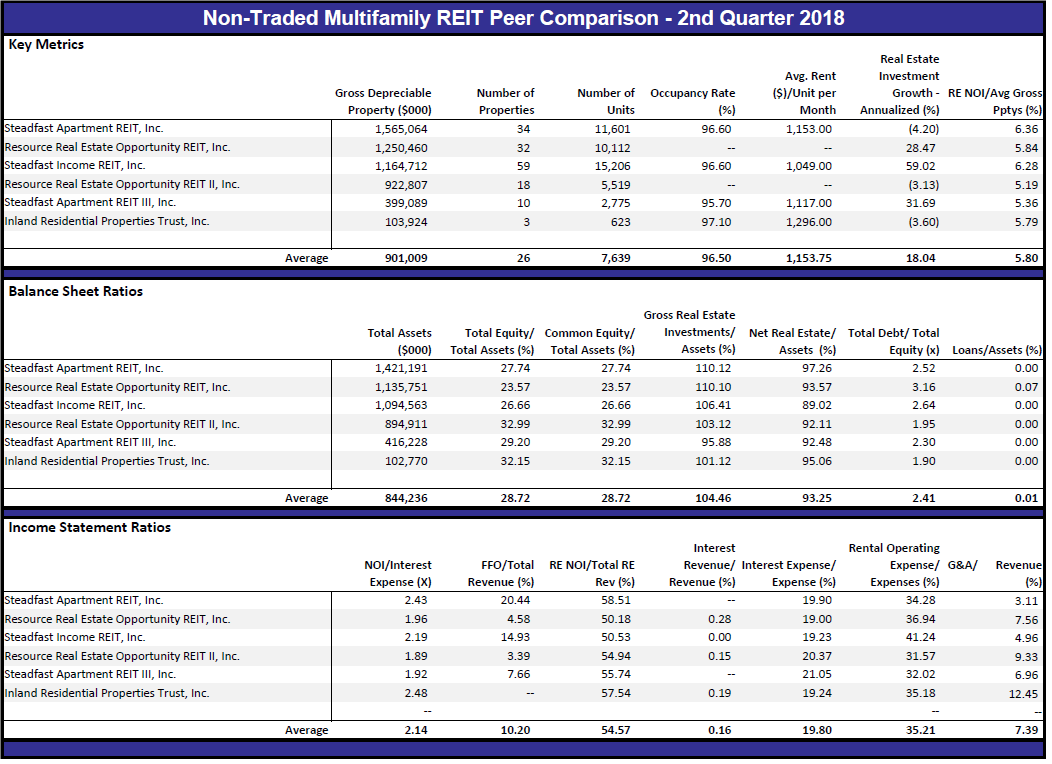
To give you a flavor of these comparisons, I’ve reproduced some of our most recent multifamily REIT peer analysis below. Log in to the Report Center for more.
In addition, S&P Global gives FactRight to ability to produce custom comparisons upon request. For instance, maybe you’d like to see how a non-traded hospitality REIT’s RevPAR, ADR, and occupancy rates compare to its traded brethren. Reach out to us to discuss further.