The interval fund market reached new heights in 2018, setting records for total net assets and new fund launches. This post will examine key metrics from last year that illustrate the growing popularity of the space with managers and investors.
Asset growth and fund launches
Total net assets in interval funds increased 41% in 2018, reaching approximately $27.5 billion based on filings available at the end of the year. The SEC declared effective 16 interval fund registrations statements in 2018, including three in in the fourth quarter. Additionally, two privately offered interval funds launched in 2018. Overall 2018 was another year of historic growth for interval funds.
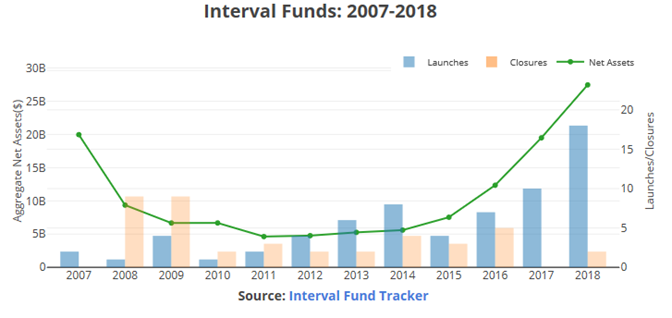
(An interactive version of this chart can be found in the original post here.)
Although there are 60 active funds, the five largest alone account for 65% of total net assets. Many funds recently launched and have yet to gain fundraising momentum. Click here for AUM data on active interval funds.
Note that all data in this post is based on SEC filings available as of January 1, 2019 unless otherwise indicated. (To access data and code behind this post, see Interval Fund Tracker’s Bitbucket repository.)
Fastest growing interval fund
Thirty-five active interval funds reported net asset growth in the most recent quarter, and 15 reported a decrease. In general, large asset managers continue to dominate fundraising. The following list shows the five fastest growing interval funds, based on net asset growth in the most recent reported quarter.
|
Fund |
Date of Reporting Period |
Net Assets Increase MRQ |
|
Versus Capital Multi Manager Fund |
September 30 |
$331,506,776 |
|
ACAP Strategic Fund |
September 30 |
$295,041,103 |
|
Griffin Institutional Access RE Fund |
September 30 |
$235,001,852 |
|
Versus Capital Real Assets Fund LLC |
September 30 |
$162,396,650 |
|
September 30 |
$136,083,896 |
Fee structures are becoming more standardized, and several service providers have become critical to the interval fund ecosystem. For detailed information on fund structure trends in the interval fund space click here.
Interval fund performance
Interval funds report total return semi-annually. Only a small subset of funds have performance histories of more than a year. As the niche grows, the total return dataset becomes will become more robust. Performance has been generally positive for funds that have reported total return data. The following chart shows ranges of three-year cumulative total returns (assuming reinvested dividends) for interval funds active the entire period.
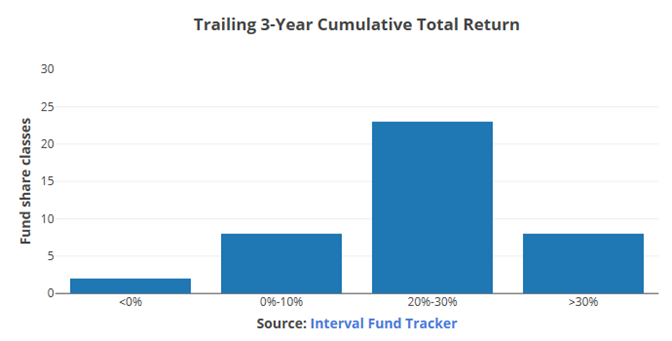
(An interactive version of this chart can be found in the original post here.) Note that this data is lagged. Late 2018 market volatility likely impacted many interval funds.
Evaluating individual fund performance requires putting it in the proper context. This includes comparing a fund to its benchmark and peers with similar strategies. Additionally, investors should consider performance in relation to fees.
Registration pipeline
Four interval funds filed initial registration statements with the SEC in 2018Q4, one of which has already been declared effective. There were 24 interval funds in registration as of the end of December, pending the release of final prospectuses and SEC approval. Based on number of funds, credit strategies, broadly defined, continue to be the most popular among fund managers getting ready to launch an interval fund.
Key takeaways
- Interval fund net assets increased 41% in 2018, reaching $27.5 billion.
- A record number of new funds launched in 2018.
- Interval fund performance has been generally positive for funds with track records.
- The recent government shutdown temporarily delayed SEC review of pending interval fund registration statements.
Note: this was originally posted by the author on Interval Fund Tracker.