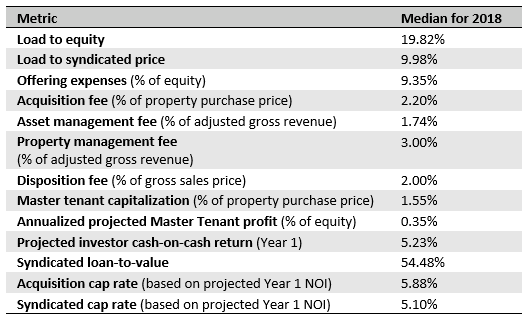
Real estate-related Delaware statutory trust offerings raised nearly $2.5 billion in 2018, one of the strongest annual tallies in the 1031 retail syndication market’s 15+ year history, according to Mountain Dell Consulting. In the past year, FactRight has reviewed a great deal of these offerings for clients. Here are the medians for key metrics from DST offerings that FactRight saw in 2018:
It bears repeating what we said last time we published DST market metrics on this blog about viewing specific offerings within the context of industry-level data:
- In some instances, appropriate and customary fees differ according to asset class. This is most pertinent for management fees.
- Many of these metrics bear direct or inverse relationships with variables such as equity raise and leverage. Small equity raises will make loads-to-equity look high, and deals with no debt will have identical load-to-equity and -syndicated measures. Relatively high (or low) LTVs can also skew metrics.
- Qualitative analysis of fee and offering structure can be just as important as quantitative. For instance, understand how the structure of the master lease for a particular offering dictates how property profit flows between investors and the master tenant, and how that impacts the risk and return profile.
- Fees in a specific deal should be considered on not only an individual, but also a global basis. Upfront fees may be relatively low, but ongoing fees could make the total fee picture less favorable than other deals.
Accurate trend analysis is very difficult and imprecise, as there is a relatively small population of DSTs syndicated each year, and even smaller sample sizes representing particular asset classes. (And while FactRight sees deals that represent most of the capital raised in the space, we don’t see everything.) Changes in customary deal size, financing terms, and other factors will bear upon movement in specific metrics. If we can say anything from the way metrics changed in 2018, it’s that FactRight’s data suggest that while upfront and ongoing fees have remained relatively consistent with last year’s metrics, properties are becoming more expensive to underwrite, finance, and syndicate.