Over the past several years, FactRight has seen a trend in increased demand for residential real estate investment programs (e.g., multifamily, build-to-rent, single family residences). While our offering-level reports provide a market overview at the MSA-level, I wanted to go a few levels higher to the national scale. This blog primarily looks at the relationship of single-family home prices and income in the United States to answer the following question: What are the implications for residential real estate programs if housing is overpriced relative to historic norms?
A useful metric: home prices-to-income
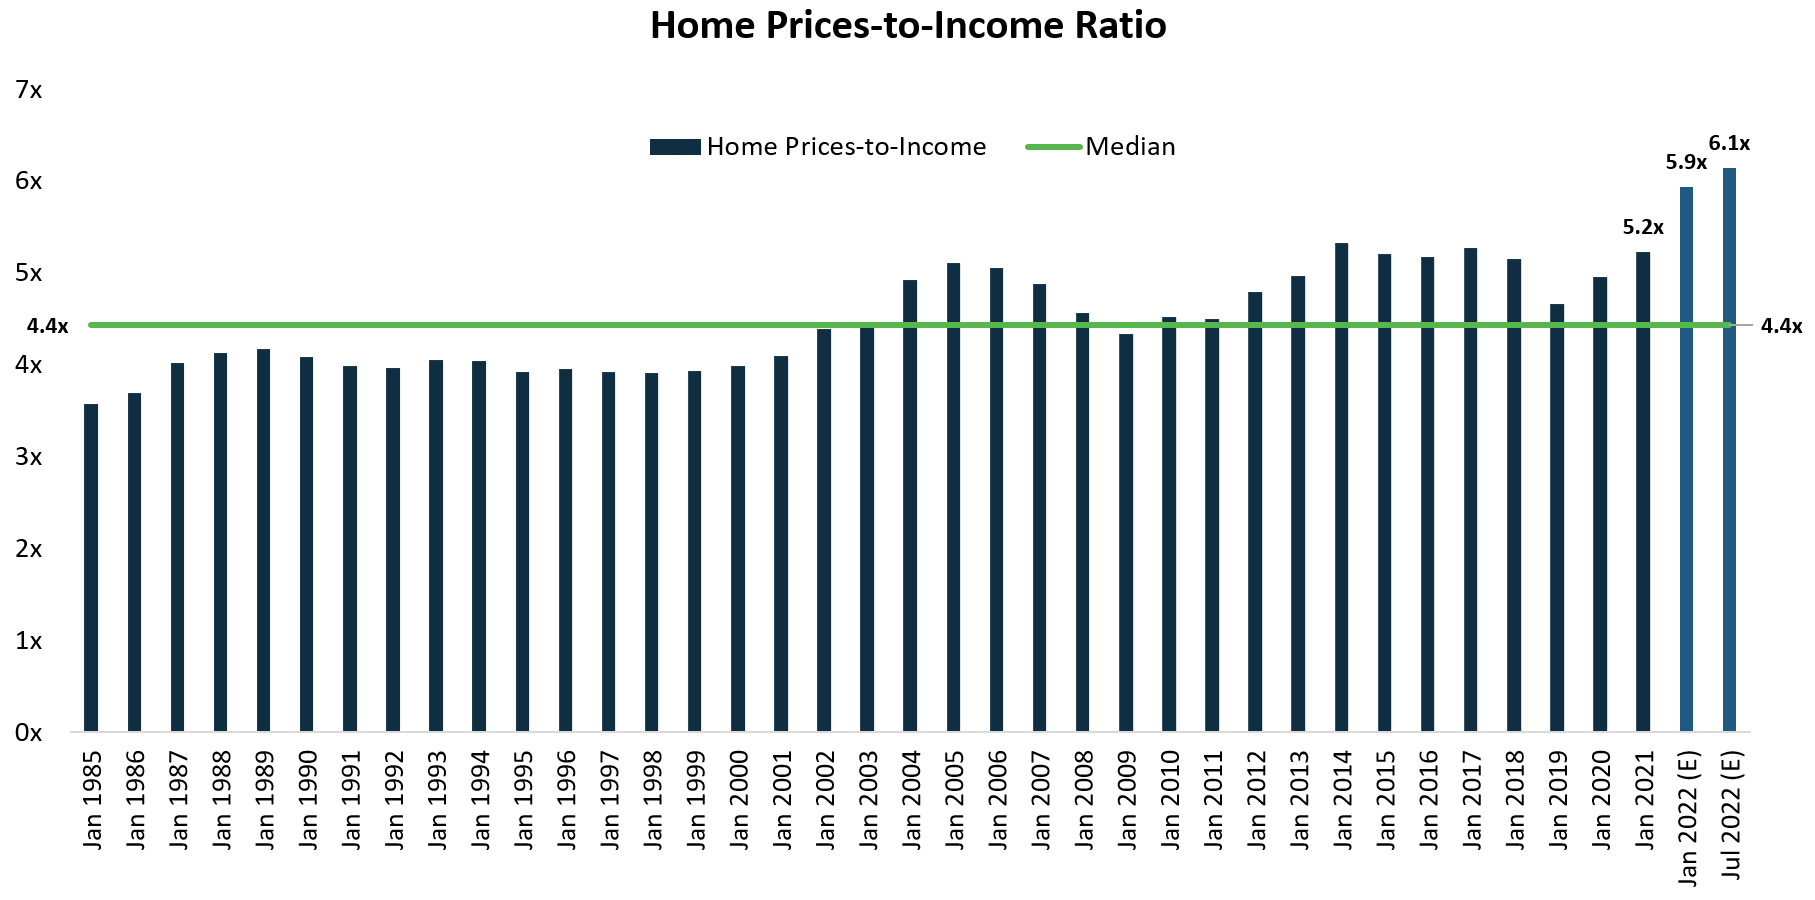
There are many indicators and data points that can be used to measure home price levels and the direction of the housing market. For this blog, I will be relying primarily on establishing a home prices-to-income ratio to evaluate current housing valuations.
The S&P CoreLogic Case-Shiller U.S. National Home Price NSA Index (Case-Shiller) is widely used to determine how the value of housing has changed on a national basis. Its methodology is relatively complex and only includes homes that have been resold (sale pairs). While these adjustments solve a lot of problems, they are not as intuitive to understand as median sales price.
To calculate the home prices-to-income ratio, I selected two simple metrics based on data publicly reported by FRED. The metrics used are Median Sales Price of Houses Sold for the United States (MSPUS) and Median Household Income in the United States (MHI).
- Median Sales Price of Houses Sold for the United States (MSPUS) is reported by FRED each quarter beginning with data since 1963. The most recent data is available through July 1, 2022. MSPUS relies on New Residential Sales from the U.S. Census Bureau.
- Median Household Income in the United States (MHI) is collected by the U.S. Census Bureau/HUD and reported annually beginning with data since 1984. MHI data may be skewed due to demographic shifts, changes in household size, and the definition of “income.” The most recent data is only available through January 1, 2021. From 1985 to 2021, MHI increased by a compounded annual growth rate of 3.10% per annum. Using that growth rate, we extrapolated MHI data to forecast the median income as of January 1, 2022 and July 1, 2022.
The reason I calculated this ratio is to provide an additional tool to evaluate the U.S. housing market. It is simply a supplement and is not meant to supersede other indicators. By using median prices instead of an index, we can more objectively calculate a multiple. Additionally, the ratio does not need to be adjusted for inflation since neither data point is adjusted for inflation.
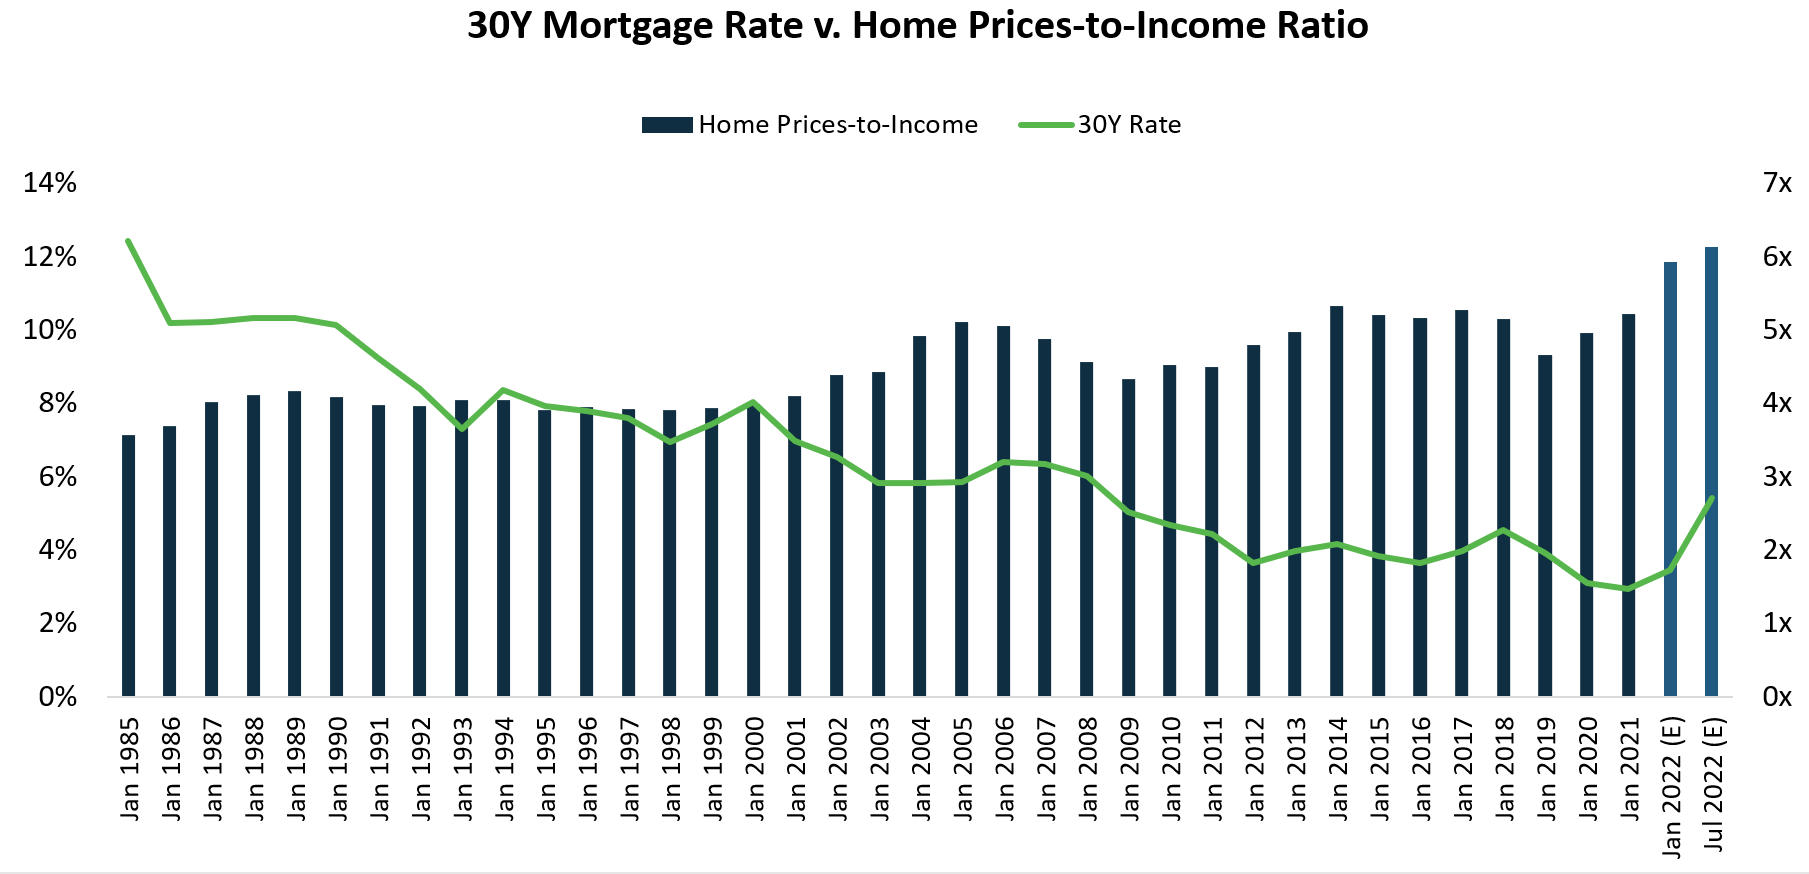
The baseline shown in the graph (green line) is the median home prices-to-income from January 1, 1985, through July 1, 2022. It should be noted that the median home prices-to-income multiple was lower before 2000, just prior to interest rates setting out on a 20-year, downward trajectory.
What will happen to the multiple as the music stops for low interest rates?
The continued expansion of the multiple naturally didn’t happen in a vacuum. Borrowing costs have a significant impact on affordability, and affordability can impact demand and home prices. A prolonged low interest rate environment, coupled with constrained supply of homes for sale, has led to the significant run up in home prices to income, as shown in the chart above.
However, the recent increases in interest rates are likely to have a substantial impact on home prices. While the timing of the full impact is unknowable, I will look at ways in which higher cost of capital might be manifesting itself in the housing market.
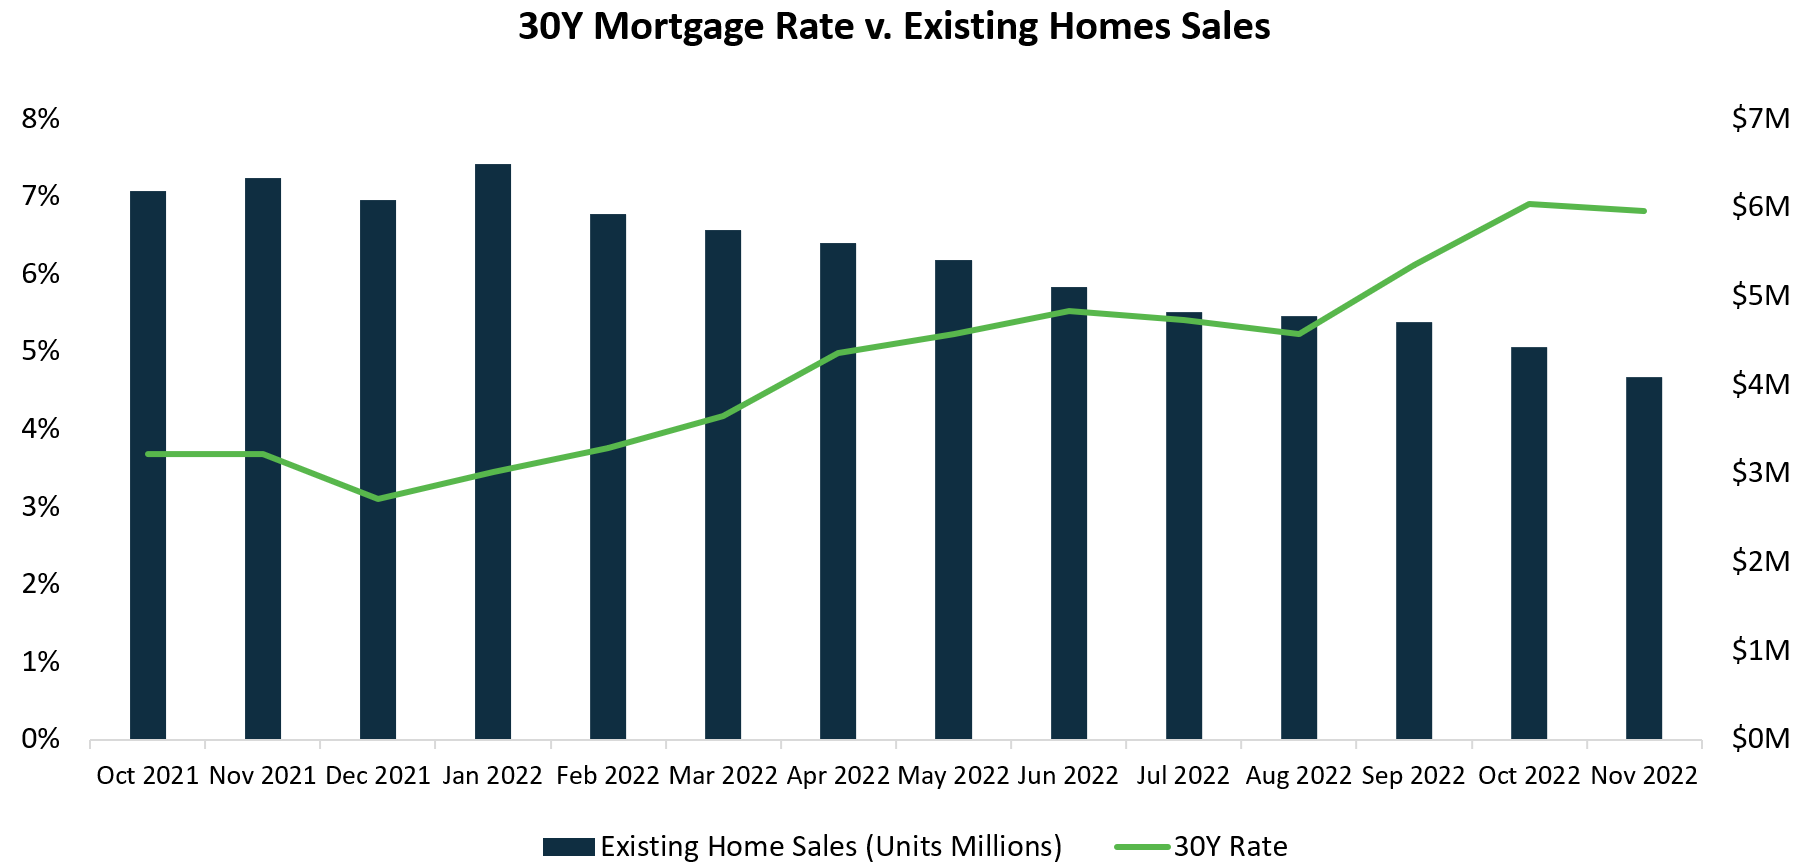
During 2022, the average monthly 30-year mortgage rate increased substantially from 3.45% on January 1, 2022, to 5.14% on July 1, 2022, in response to the Federal Open Market Committee’s rate increases. The rate was 6.49% as of December 1, 2022. As of November 2022, New Residential Sales had yet to be impacted by rates, and the median sales price for new houses sold was $471,200, up approximately 4% from July 2022.
However, mortgage applications and sales volume for existing homes have declined over the past year as the 30-year mortgage rate increased. Buyer cancellations for homebuilders also appear to be increasing.
Demand going forward
Demand has declined during the past year, and negative sentiment indicates that this trend is likely to persist.
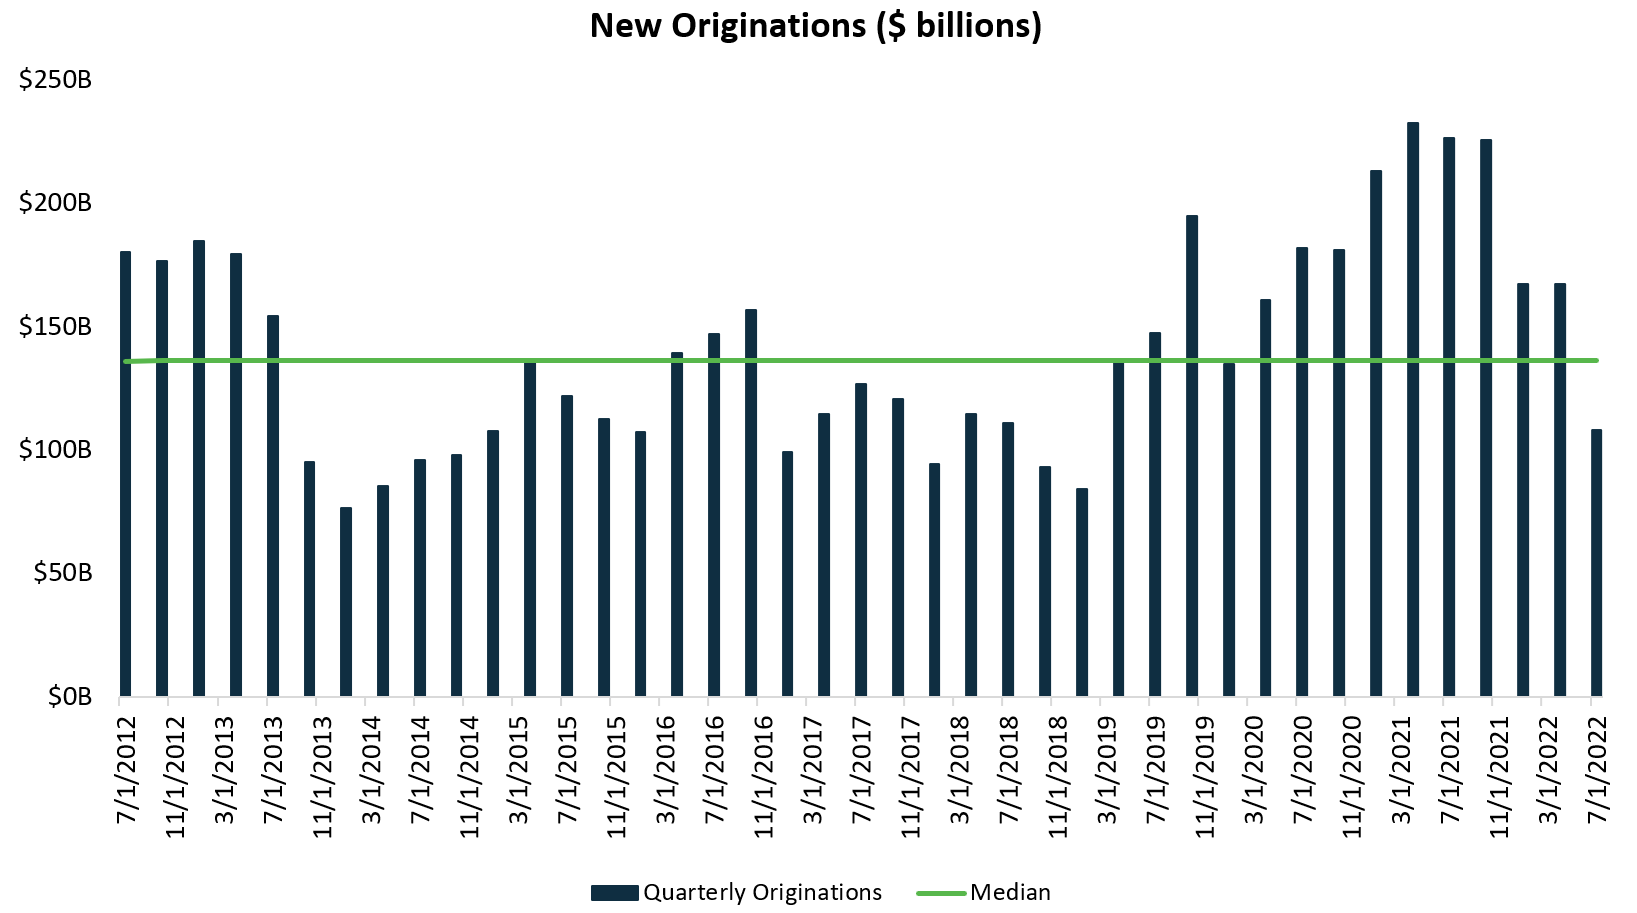
FRED reports new first-lien originations that are held in the originators’ portfolio at the end of the quarter. While it excludes loans sold during the quarter, we are using it as a proxy to identify trends in transaction volume. The following chart shows quarterly originations over the past decade. New mortgage originations decreased during 2022, and they fell 20.8% below the 10-year median as of July 1, 2022.
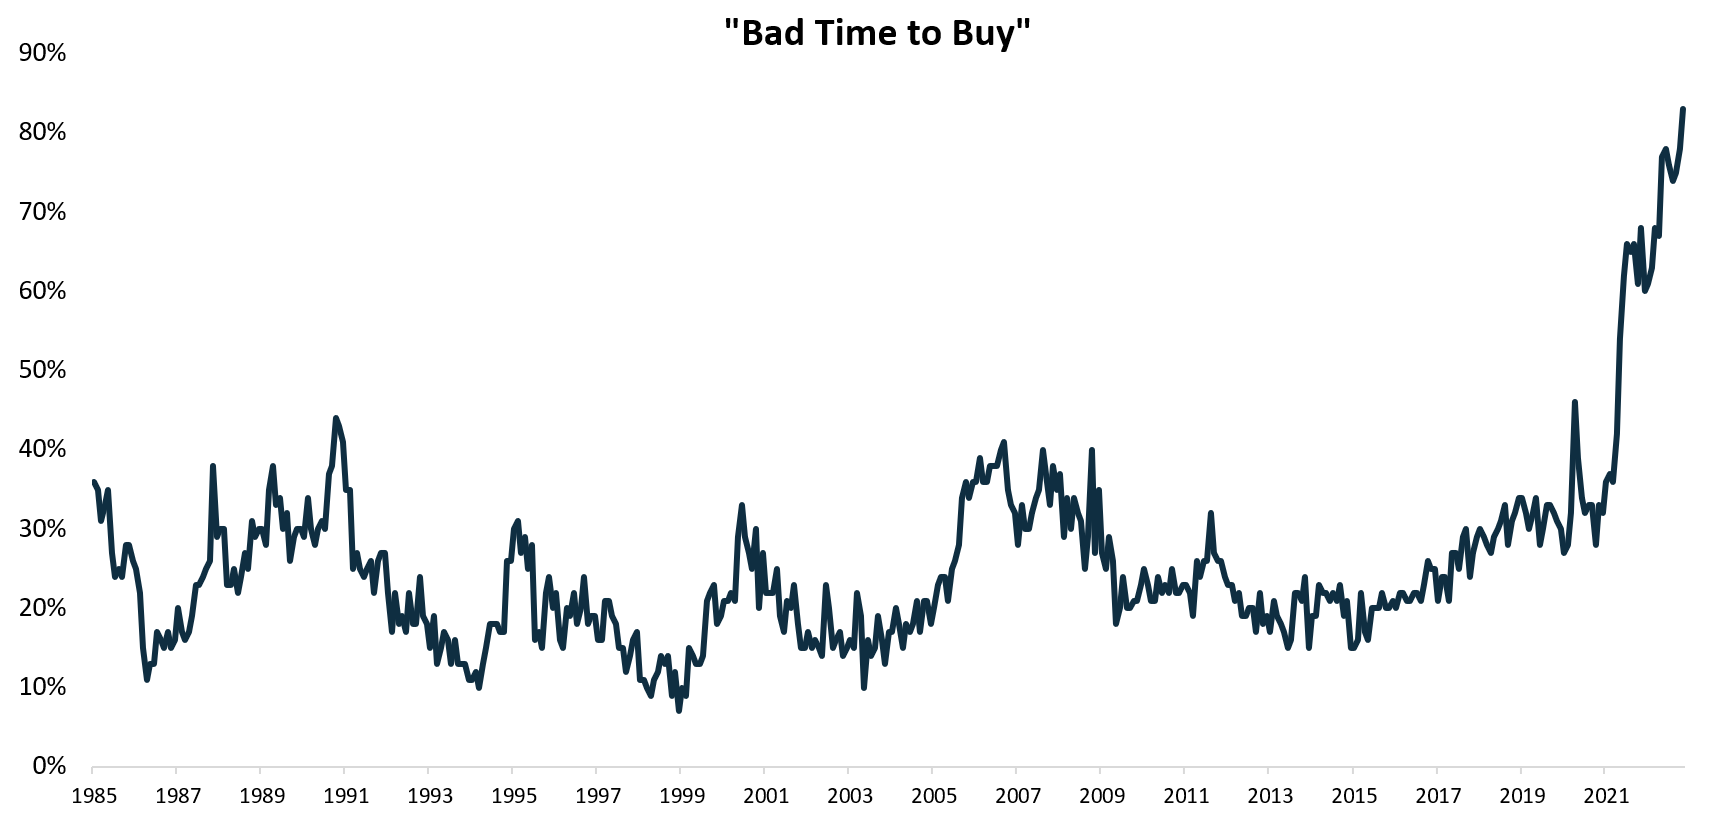
Each month, the University of Michigan issues surveys to track sentiment, a leading indicator. According to its “Buying Conditions for Houses” survey, the November 30, 2022, figure, 83% of respondents replied that now is a “bad time” to buy a house.
So, is housing overpriced?
Yes, if the answer is based on the historic relationship between home prices and income and the negative sentiment that could be foreshadowing a continued dampening in transaction volume. If assumptions about future MHI are reasonably accurate, then home prices-to-income has expanded significantly over the past year and indicates that the U.S. housing market is expensive on a long-term historic basis. If the home prices-to-income ratio reverts to the historic mean, there could be a material correction in home prices. Of course, the risk of a pricing correction would need to be further contextualized based on the local market when looking at geographically-concentrated real estate programs.
There are many factors to consider when analyzing housing. Credit quality of borrowers, loan-to-value levels, mortgage-treasury spreads, population growth, demographic trends and the recent introduction of institutional single-family rental investment vehicles, which have been pioneered and grown significantly over the past decade, are all factors worth exploring. Furthermore, not all “housing corrections” are of equal magnitude– different cycles have different backstops, some requiring more severe adjustments than others. For instance, there is substantially less leverage and a higher quality of homeowner in the market today than there was in 2008.
My hope is that the home prices-to-income ratio will aid in due diligence of housing-related investment programs. Then, what are the implications for such investment programs when the ratio is high by historical standards?
If there is risk of a pricing correction, it will be critically important to find sponsors with acquisition teams that are able to acquire assets at reasonable prices and asset management teams that can manage the properties efficiently over a long-term holding period. If there is reduced demand for new housing purchases due to affordability concerns, this may increase the pool of renters with attendant effects on rental supply-demand dynamics. And ultimately, it behooves anybody undertaking due diligence to assess the reasonableness of the assumptions underlying the financial model and to perform sensitivity analysis to see how the program may perform under different scenarios. If the modeled returns require continued appreciation in residential real estate, you might want to pass at this time.